Week 11: Open Efforts regarding COVID19
To be honest, I was slowly losing my faith in humanity until the beginning of this year. Not that I am very old and have seen a lot, but even I witnessed how corporate companies build walls around their ecosystems and how people’s lifestyles changed in the ~20 years I lived. Apparently, old software and hardware (for example, television sets) used to come with a user manual and schematics that explained how the device was built & worked, just in case you needed to repair it yourself (see the PDF below). Nowadays, companies prevent third parties from buying their proprietary chips, let alone providing the schematics & diagrams or embracing open source. Many people are trying to fix some of these problems with the “Right to repair” movement to let companies make parts and/or schematics available again. I hope this issue will be someday & somehow will be solved.
“Admiral TV Installation, Alignment & Service Data” manual from 1961 (Source: One Electron)
Similarly, the tendency to get more and more closed source is all over our lives. Yes, there are great open source projects, but still, the general trend is going towards the closed source. Surprisingly, this trend changed at the beginning of this year! It is amazing to see how COVID19 brought all of us together again to collaborate. A lot of large and small scale open source projects popped up recently. They all try to tackle the same problem but in different ways, the COVID19. For example, some researchers are designing ventilators, and they are making all of the schematics available to the public, while others are working on software to collect and visualize data on how COVID19 spreads. As a class, we gathered some of these open effort to fight COVID19 here.
As a part of my blog, I wanted to list some of my favorite projects that was shared in our class repository:
Predict COVID-19
Predict COVID-19 is an interactive tool to compare the number of COVID-19 cases between different countries to understand how the epidemic might progress in the coming days. This project is periodically scraping data from the WHO database for coronavirus and creates the graphs for comparing the countries. I think this tool excellent for individuals or companies to make plans for the future because they can make guestimates based on these graphs.

A screenshot of the graph comparing the current status of the US with other countries
2019 Novel Coronavirus COVID-19 (2019-nCoV) Data Repository by Johns Hopkins CSSE
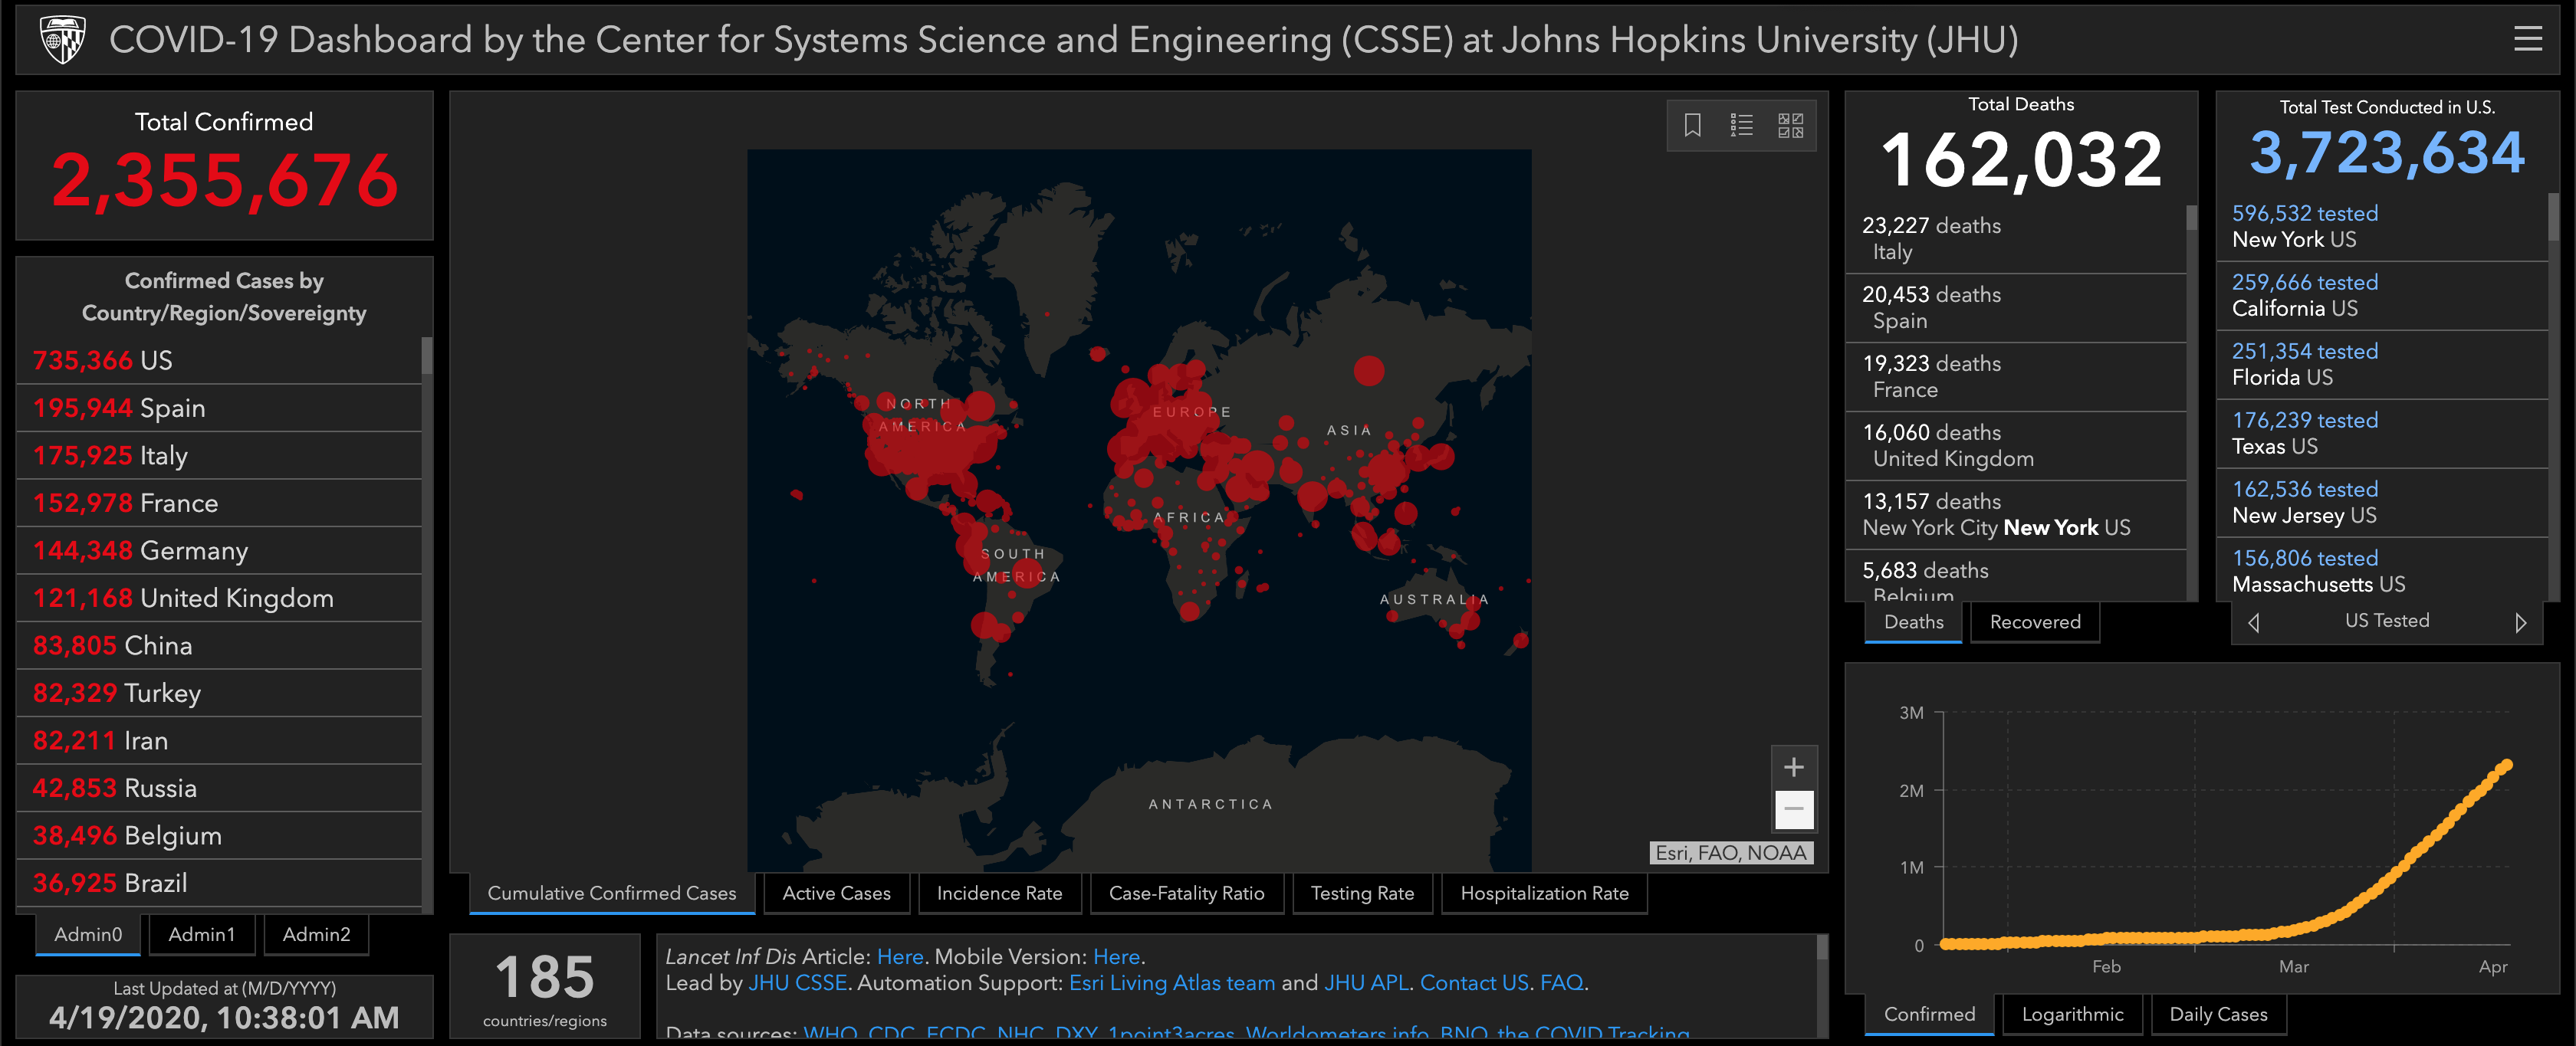
This one is probably one of the most famous ones since it was one of the first tools that were created to collect data and visualize the COVID19 cases around the world. They use more than 18 data sources, including but not limited to the World Health Organization, China CDC, US CDC, Ministry of Health Singapore, Italy Ministry of Health, and WorldoMeters. This project creates a single data source that composes of multiple data sources, and it makes researchers’ life easier since researchers don’t have to spend time finding the individual data sources.

A screenshot of the dashboard created by Johns Hopkins CSSE
Safepaths
This project aims to track people’s locations to accelerate contact tracing while keeping the individuals informed if they were in contact with someone who is diagnosed with COVID19. They claim that the data never leaves the user’s device without their password entry and explicit consent. I hope this project doesn’t have any security issues to keep users’ information private. That being said, I think this is an amazing idea for tracing the virus. Virtually everyone uses a mobile phone, and people carry their mobile phones all the time. So, utilizing such an app can make it easier to trace and stop the spread of the virus.
Open Source Covid-19 Ventilator Canada
This project might be the most important one. The other projects that I mentioned are for preventing the spread of the virus or making future plans, but this project is trying to save people who are already infected. Yes, we should prevent the spread, but also we should somehow save the infected people and keep the healthcare system working by providing more ventilators. Now, with the help of this project, ventilators can be produced faster and cheaper.
Closing remarks
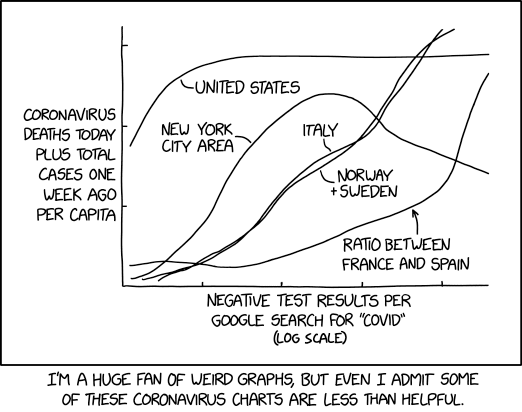
It was surprising to see the diversity of the projects we discussed in the class. There were projects that dealt with producing hardware, producing data, and visualizing the generated data. I especially liked looking at the data visualizing projects since they helped me to understand the scale of this epidemic. I also want to admit that sometimes I get lost in the coronavirus graphs produced by these projects. I am not sure if it is something related to me or related to the graphs themselves, but some of these graphs are really difficult to understand. The good thing is, all of these projects are open source, and I/you can contribute to these projects to make these graphs easier to understand. That’s why I love open source. If you don’t like something or have any improvements, you have the power to change it. You might need to fight a little bit with other contributors, but it is definitely possible.

It is true that sometimes I get lost in these graphs (Source: xkcd: Coronavirus Charts)